The Town of Innisfil's Municipal Dashboard highlights how we're performing as an organization. The dashboard includes 14 measures that represent a variety of Town services and community objectives. From road conditions to average response times, we collect and analyze data on an annual basis to determine if we're meeting service targets or if more work is needed to deliver the desired results.
The Municipal Dashboard currently reflects year-end 2025 results and will be updated with 2026 results once they are finalized.
We evaluate how well we're doing in meeting our objectives in each area by establishing Key Performance Indicators (KPIs). KPIs are measurements that are compared to established goals to measure performance and identify areas for improvement.
Using the Municipal Dashboard
The dashboard is organized into four pillars that align with the Town's Strategic Plan to help staff meet identified objectives.
You can select each pillar to explore its objectives, results, and significance.
Strategic priority: Grow
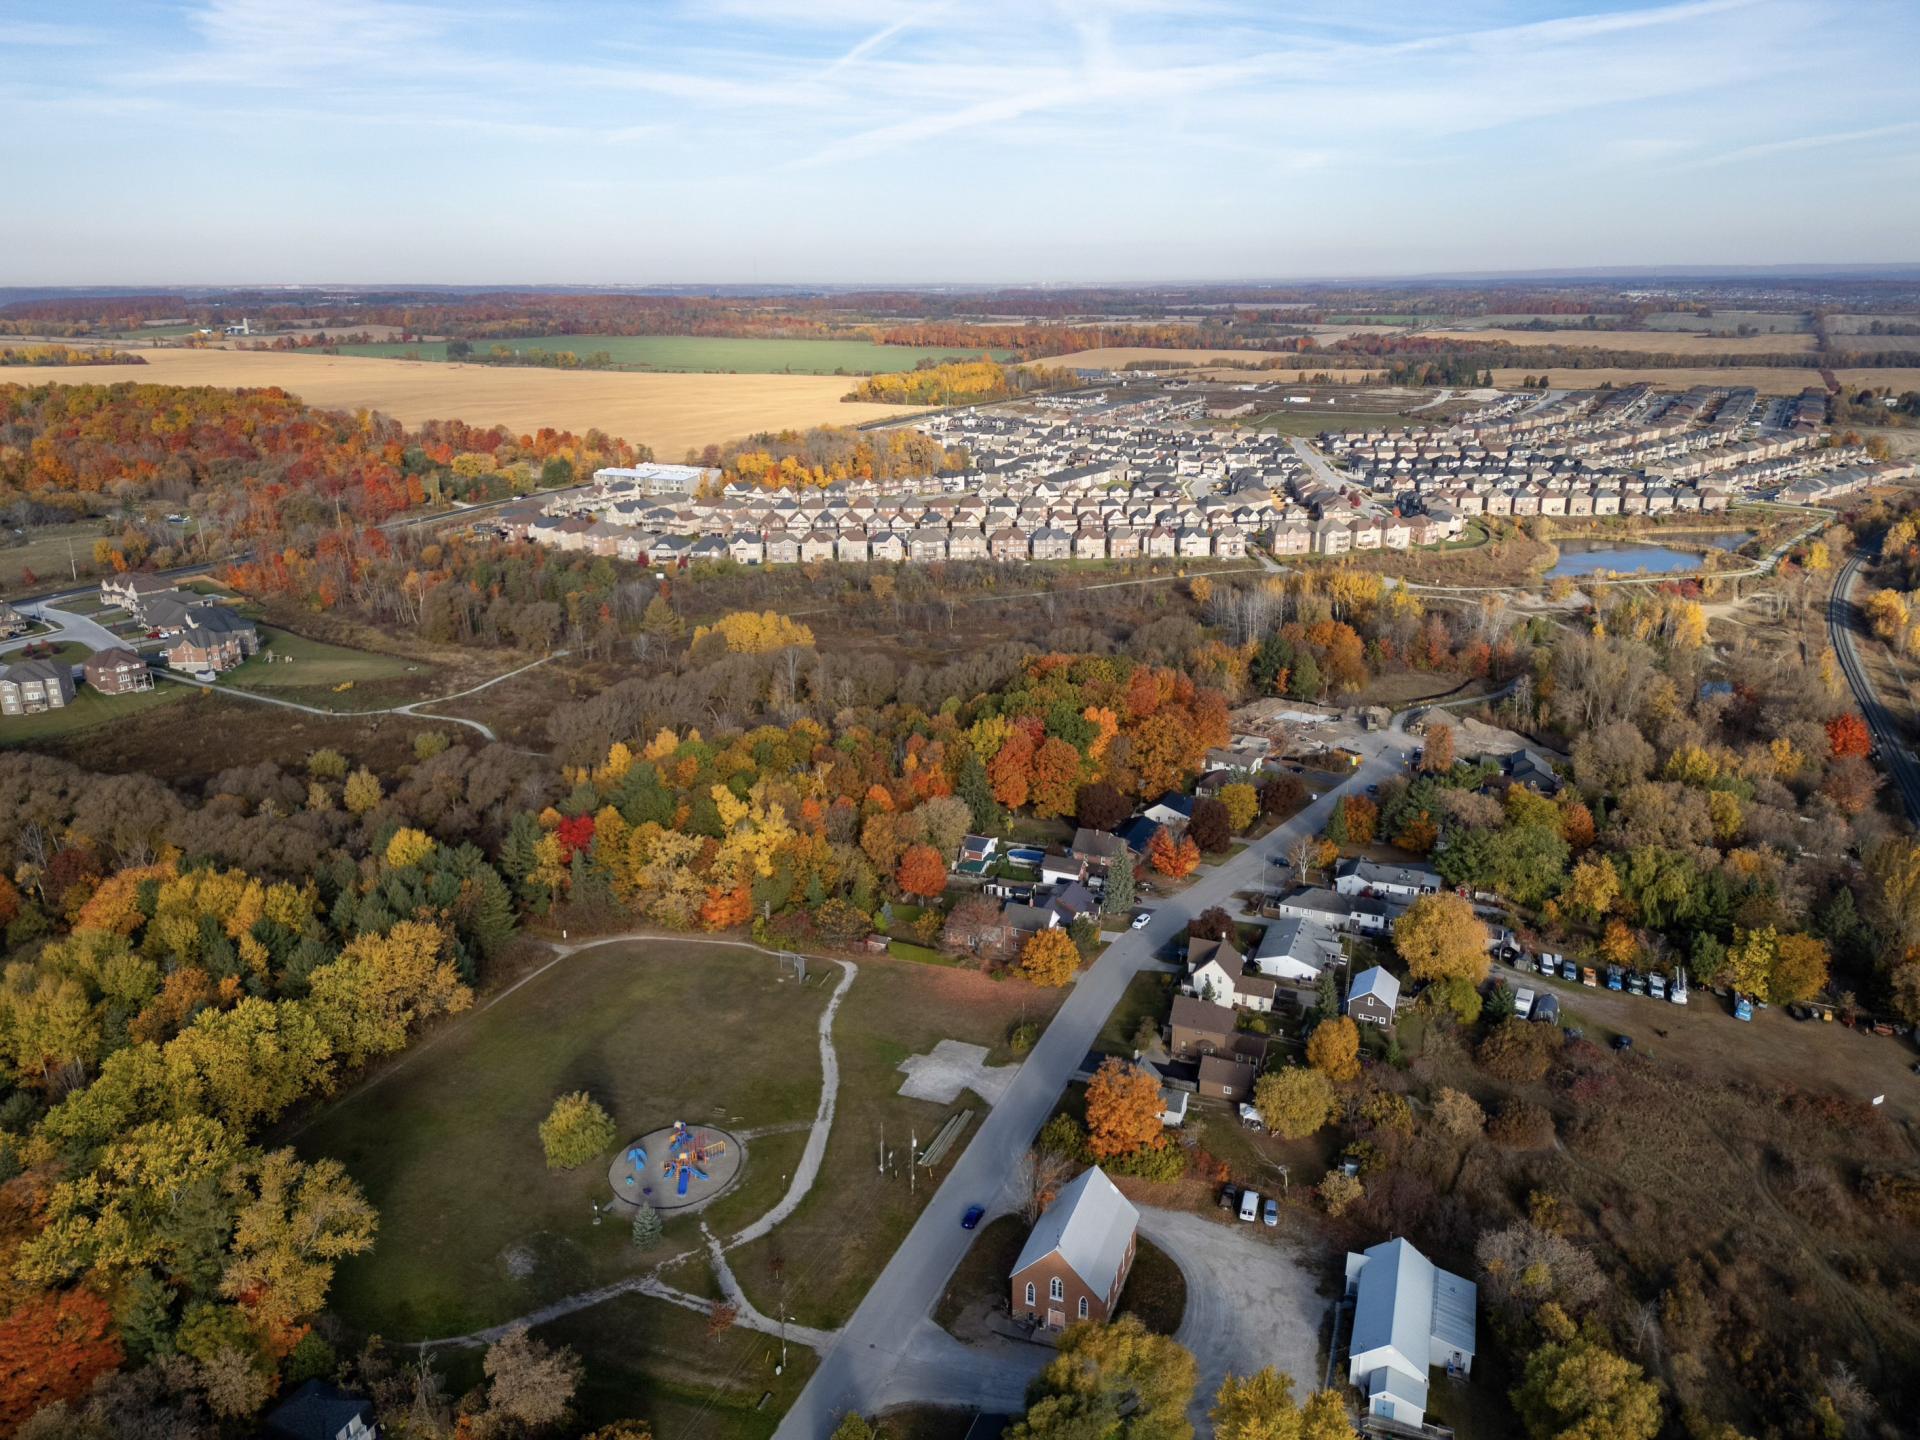
We are a growing community. Through proactive and smart planning, we work towards the strategic balance of enabling Innisfil to grow and thrive while also celebrating and respecting the unique mix of urban, rural, and agricultural spaces that make it special.
Innisfil has identified three measures under "Grow" that help us understand how well we are managing and responding to growth in our community.
| Metric | Service level target | Results | Outcome |
|---|---|---|---|
| Number of businesses | Maintain or increase year-over-year | 5,355 | Higher than forecasted |
| Number of jobs | Grow by 3% over the next five years | 14,354 | Higher than forecasted |
| Number of new residential lots serviced | Continued progress | 155 | Lower than forecasted |
See the full report on results for Grow
Strategic priority: Sustain
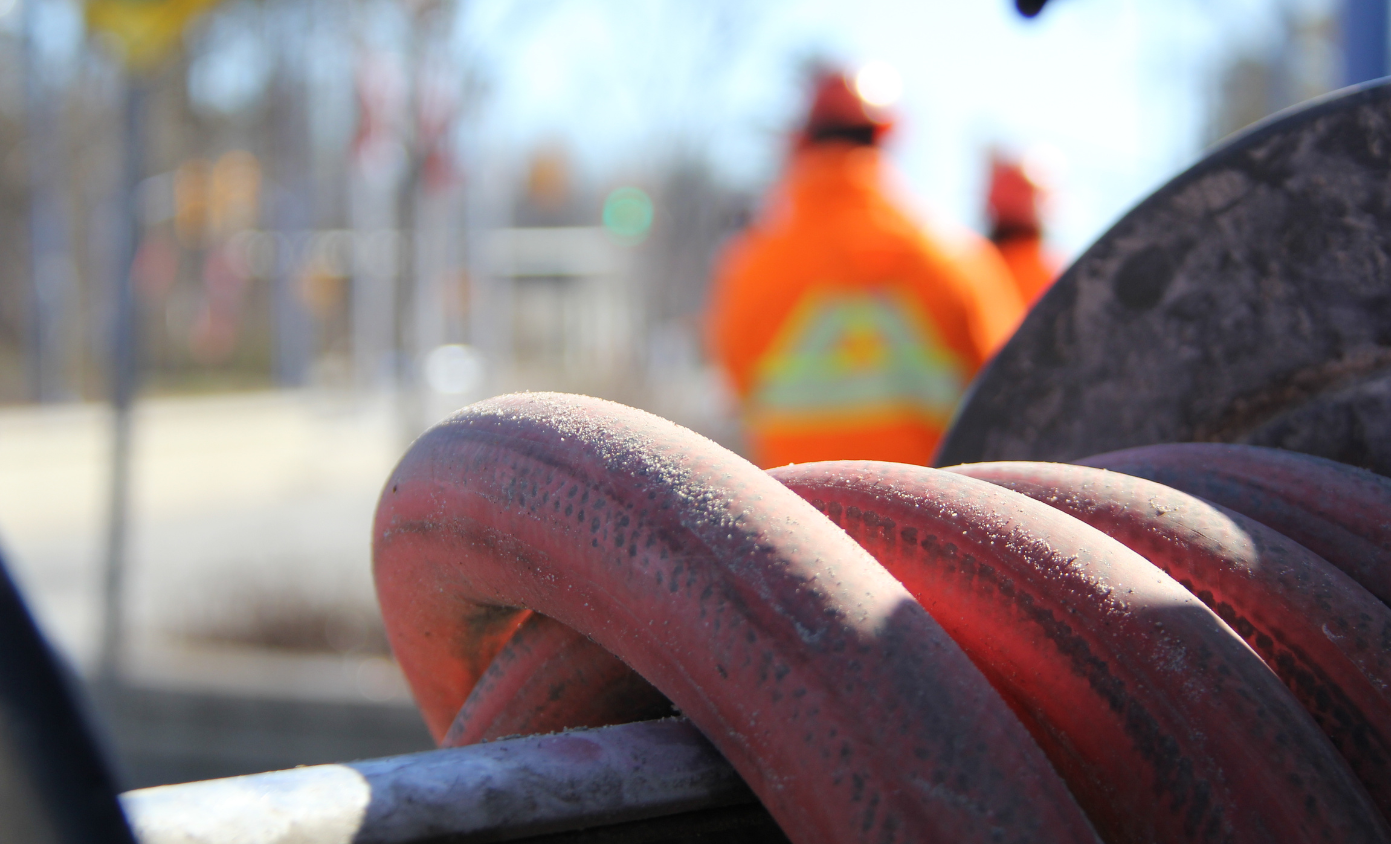
We embrace the principles of sustainability as we actively protect, maintain, and enhance the environment, assets and amenities that our residents depend on.
Innisfil has identified three measures under "Sustain" that help us understand how well we are managing investments in our community.
| Metric | Service level target | Results | Outcome |
|---|---|---|---|
| Operating budget variance | Within 0-3% (surplus) | 5% | Almost met |
| Average annual investment return | Average annualized return of 3% | 8.63% | Met or exceeded |
| Debt repayment level | Do not exceed 20% | 5% | Met or exceeded |
See the full report on results for Sustain
Strategic Priority: Connect
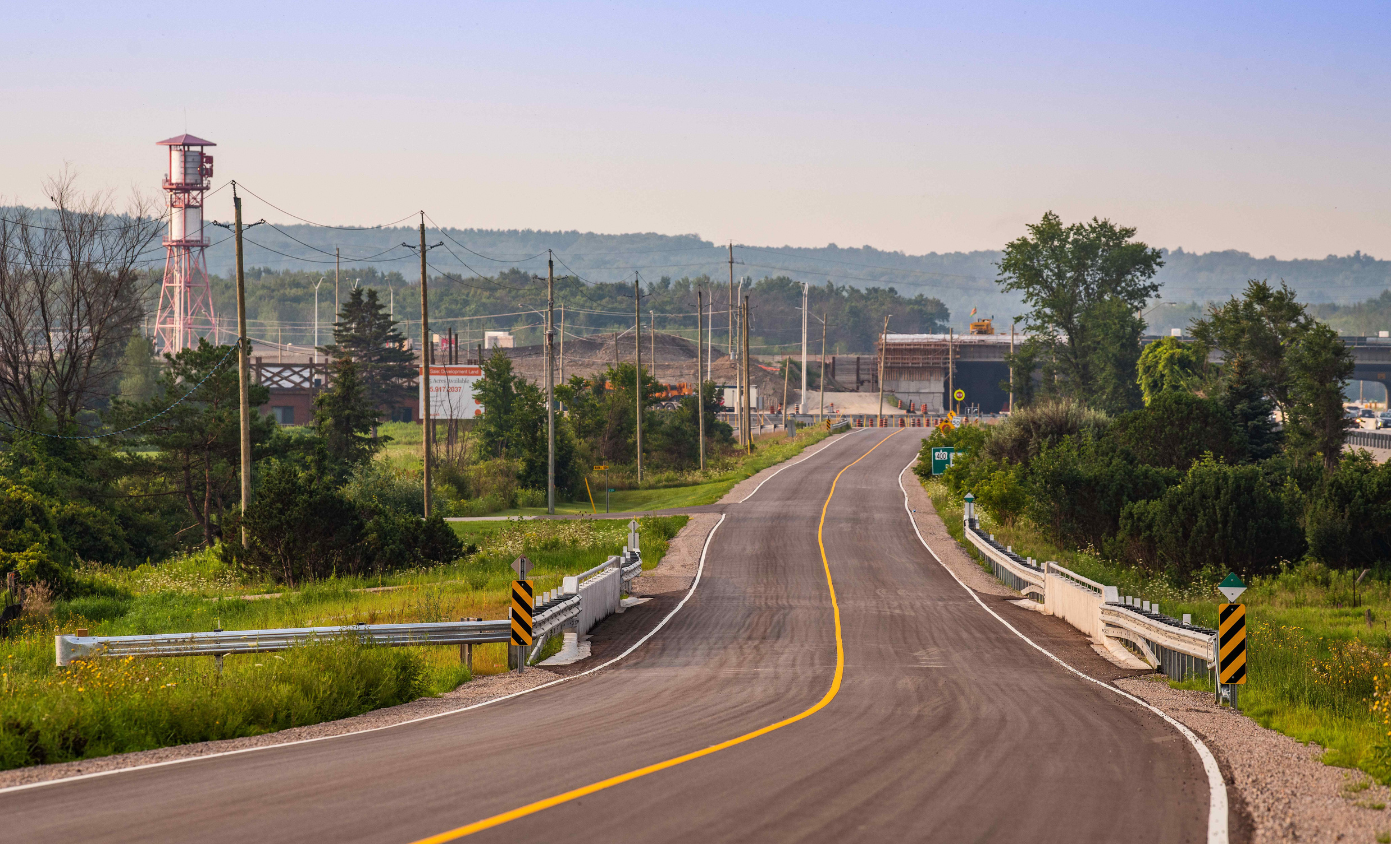
We build connections at all levels—physically, socially, and culturally—to support the overall well-being and vitality of our community.
Innisfil has identified three measures under "Connect" that help us understand how well we are supporting the overall well-being and vitality of our community.
| Metric | Service level target | Results | Outcome |
|---|---|---|---|
| Roads in fair or better condition | 90% of roads | 88% | Almost met |
| Innisfil Transit - average wait time | 8.5 minutes or less | 4.44 minutes | Met or exceeded |
| Innisfil Transit - number of trips | Approximately 190,00 trips | 149,862 trips | Lower than forecasted |
See the full report on results for Connect
Strategic Priority: Serve
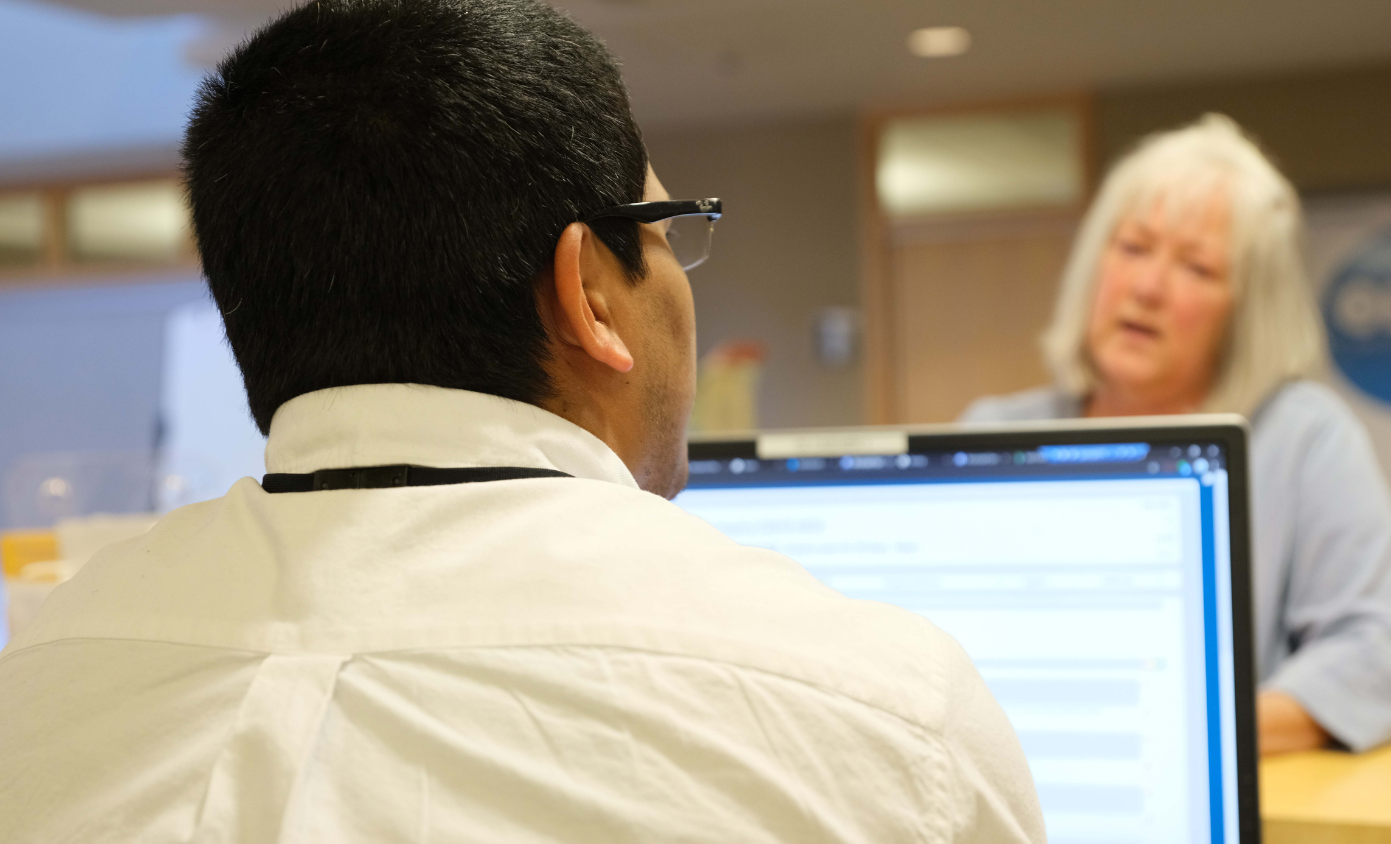
We work together to deliver high quality programs and services, with a focus on accountability, value-for-money, and innovation.
Innisfil has identified five measures under "Serve" that help us understand how well we are responding to the needs of our community.
| Metric | Service level target | Results | Outcome |
|---|---|---|---|
| Fire & Rescue average response times | 8.5 minutes or less | 9.87 minutes | Missed |
| Average wait time of inbound Customer Service calls | 5.0 minutes or less | 4.94 minutes | Met or exceeded |
| Satisfied recreation participants | 80% of participants give a satisfaction score of 8/10 (or better) | 85% | Met or exceeded |
| First contact resolution rate | 80% or more resolved at first contact | 90% | Met or exceeded |
| Average days to close a by-law case | 20 days or less | 14 days | Met or exceeded |