|
Service level target |
||||||||||||
|
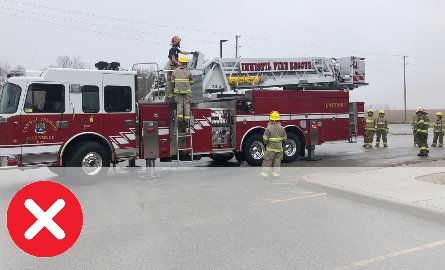
The Town's target is an average response time of 8.5 minutes or less for Fire and Rescue Services emergency calls (excluding non-emergency) across Innisfil. |
||||||||||||
|
How is this measured? |
||||||||||||
|
Innisfil Fire and Rescue Services records and tracks each call received and measures the time from when fire apparatus are dispatched until the first apparatus arrives on scene. This data is then used to calculate the average response time for emergency and fire calls for the year. When the average response time for the first arriving apparatus is 8.5 minutes or quicker the result is green. The average result is red if it exceeds the target by more than thirty seconds, and yellow if the average result falls in between. |
||||||||||||
|
Why is this measure important? |
||||||||||||
|
Measuring the time it takes to respond to a Fire and Rescue Services emergency call is critical to the protection of our residents and community. Effective and efficient responses to fire emergencies helps reduce injuries and fatalities, as well as property loss. Similarly, rapid responses to medical emergencies increases the likelihood of patient survival. |
||||||||||||
|
Historical results |
||||||||||||
|
||||||||||||
|
What does this result mean? |
||||||||||||
|
Innisfil Fire and Rescue Services continues to improve service performance to ensure services are working effectively to support a timely response to emergencies. The department continues to identify clear roles and responsibilities, standard operating guidelines and provide ongoing training to staff. Fire and Rescue Services continues to maintain a full complement of career and volunteer firefighters to better achieve the service level target and educate the public on fire prevention and safety and enforce Ontario Fire Code compliance. |

|
Service level target |
||||||||||||
|
The Town's objective is for Customer Service to answer inbound calls within 5.0 minutes of the call being received by the Town's phone system, including call answer hold time and call back wait time. |
||||||||||||
|
How is this measured? |
||||||||||||
|
The Town’s phone system provides for detailed measurement and reporting of call data, including the wait time for each call and the average wait time of all calls over a period of time. The wait time measures the time a caller remains on hold before being connected to an available Customer Service agent or the time required for the automated call back to connect with the caller’s number, if the caller has chosen the call back option. The result is green if the average does not exceed the target, red if it exceeds the target by more than one minute, and yellow if the result falls in between. |
||||||||||||
|
Why is this measure important? |
||||||||||||
|
While residents access Town services using a variety of channels, the phone remains the most popular way for residents to interact with Customer Service. Tracking wait times is essential for evaluating overall service performance and maintaining operational efficiency. We respect the value of our customer’s time and the impact wait times have on the customer experience. Monitoring average wait time enables management to take appropriate action if the time exceeds the service level target. |
||||||||||||
|
Historical results |
||||||||||||
|
||||||||||||
|
What does this result mean? |
||||||||||||
|
The Town’s Customer Service continues to successfully meet the service target and explore ways of improving the service level target and performance. Implementation of the call back feature has enabled us to maintain a reasonable service level target and excellent service level performance despite ever increasing call volumes. Callers that opt for an automated call back instead of waiting on hold are able to go about their day while their place in the call queue is maintained. When the caller’s position reaches the top of the queue, the phone system automatically connects with the caller when the next agent is available. |
|
Service level target |
||||||||||||
|
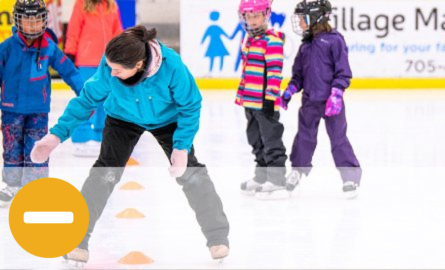
Our recreation programs aim to have 80% of program participants give an 8/10 (or better) satisfaction score on their program surveys. |
||||||||||||
|
How is this measured? |
||||||||||||
|
Our Sport and Recreation team surveys recreation program participants after they complete a session. A rating scale is used to determine participant satisfaction levels. Participants can select a number from 1 (disappointed) to 10 (exceeds expectations) to describe their experience. At the end of the program season, the Sport and Recreation team calculates the percentage of participants who gave a rating of 8/10 or higher which represents the value presented. |
||||||||||||
|
Why is this measure important? |
||||||||||||
|
The survey results illustrate how well the recreation program offerings are serving the needs of the participants. A high score indicates a well-designed and run program. A low score indicates a program that needs work or isn’t a good match for the needs of the participants. When low scores are discovered, the Sport and Recreation team looks more closely at the program to understand where expectations are not being met. The Sport and Recreation team learns from regular interactions with customers and survey data to identify common and re-occurring issues and implement corrective measures as part of our continuous improvement cycle. |
||||||||||||
|
Historical results |
||||||||||||
|
||||||||||||
|
What does this result mean? |
||||||||||||
|
Overall, 75% of program participants are telling us that they believe their program sometimes meets expectations, always meets expectations, or exceeds expectations. A good score isn’t a reason to stand still! The Sport and Recreation team continues to research recreation trends and participant needs and make adjustments to ensure that our programs continue to deliver positive outcomes for individuals. Note that our participant surveys were not completed in 2020 due to the COVID-19 pandemic, and instead the survey method was reviewed and updated before being re-launched in 2021. |

|
Service level target |
||||||||||||
|
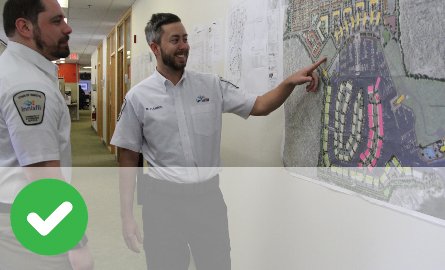
Our Customer Service team aims to achieve a first contact resolution rate of 80%. |
||||||||||||
|
How is this measured? |
||||||||||||
|
First Contact Resolutions (FCRs) are inquiries resolved in the first contact when a customer contacts the Town to make an inquiry or complaint. The rate is calculated by dividing the number of inquiries that are resolved in the first contact by the total number of inquiries during a calendar year. |
||||||||||||
|
Why is this measure important? |
||||||||||||
|
FCRs are important because it means that the customer has received a response/resolution to their inquiry within their first reach out to the Town. This is the most effective use of their time and our resources (their tax dollar). It also builds trust that staff are knowledgeable, resourceful, and efficient; and removes the stereotype of "red-tape" and siloed inefficiencies. Understanding FCR rates helps identify areas where we can enhance information available publicly, and where we can expand the skills and resources for frontline staff. |
||||||||||||
|
Historical results |
||||||||||||
|
||||||||||||
|
What does this result mean? |
||||||||||||
|
The day-to-day operations of Customer Service evolved significantly in 2021. The services we provide were delineated across three service categories within the team structure: 1. Service Counter 2. Call Center 3. Resolutions Our Information and Intake team receives all new inbound inquiries from our residents through our Service Counter, Call Center, and a variety of digital channels. They are focused on delivering first contact resolutions, and logging inquiries/complaints requiring further action or internal consultation or investigation. Our Resolutions team manages the ongoing customer journey of all public inquiry files and facilitates the internal consultation, investigation and related action items to ensure timely responses and effective long-term solutions are delivered. The team maintains open communication with customer and acts as primary liaison over the course of the journey. Since implementing our new operating model, we have had our FCR rate remain steady and our resources are more effectively deployed across the customer journey, despite seeing an increase in inquiry volumes and their complexity. |
|
Service level target |
|
The Town aims to close each by-law case within 20 days from being opened. |
|
How is this measured? |
|
All cases opened within the year are recorded in our internal tracking system. Cases are tracked from the opening date until the case has been resolved and is marked closed/completed. Once the case has been closed, the number of days to close the case is calculated by finding the number of days between the opening and closing dates of the case, then total number for all cases are then averaged for the current year. |
|
Why is this measure important? |
||||||||||||
|
The number of days to close a by-law case is important in ensuring we are resolving cases in a timely manner for our residents. We strive to resolve all by-law cases within 20 days (with a tolerance of 30 days) so that cases are resolved within a month and do not roll forward and continue to cause grievances for our residents. It’s important to note more complex case types or files can take more time than files that can be resolved on first contact or through education. |
||||||||||||
|
Historical results |
||||||||||||
|
|
What does this result mean? |
|
By-law continues to successfully meet our commitment to resolve community concerns in a timely fashion. We continue to review our response times and make adjustments as needed to ensure we continue to meet the service level expectations of the community. By-law is also looking at ways to enhance our reporting capabilities so we can further refine our service level targets and the plans to achieve any revised targets. |